In this article iam trying to note some key questions and tips which are related to SQL SERVER CPU issues . This is collected from various links which i have added and will be modified meantime when needed correction.
What is User Mode and Kernel Mode.
How you will find under sql server what is happening that caused CPU resource high ?
How to find cpu
spiked due to single/Multiple query or from SP ?
CPU USAGE FROM
SYSTEM PROCESS IN SQL SERVER ?
Other factors which can impact SQL Server query performance ?
What is User Mode and Kernel Mode.
We need to remember that CPU consumes time in
two modes:
·
User mode
·
Kernel mode
This can be seen via Performance Monitor by
monitoring the “% Privileged Time” and “% User Time” counters under the
“Process” node. If “% Privileged Time” value is more than 30%, it’s generally
caused by faulty system drivers or antivirus software. In such situations, make
sure the BIOS and filter drivers are up-to-date, and then try disabling the
antivirus software temporarily to see the change.
If “% User Time” is high then there is something
consuming the user mode of SQL Server. There are several known patterns which
can cause high CPU for processes running in SQL Server, including:
1.
Query executing causing
high CPU
2.
System tasks are
consuming CPU
3. Excessive Compilation and
Recompilation of queries
Most common
causes for cpu usage high are
Query execution causing CPU spike (Most
commonly caused by optimizer picking bad plan).
High compiles and recompiles. (schema, Stats
change, Use of Temp table, Recompile hint).
System threads spiking CPU (Ghost cleanup,
Lazy writer, Resource monitor).
Running many traces.
To
find the session causing cpu .
·
SP_WHO2
·
Activity Monitor
·
Through some DMV’s
·
We can check any locking, blocking and deadlock
info in the server.
select * from sys.sysprocesses where blocked
>0
If the above query doesnot have any record then try to find query which might be taking
most of the CPU time. Execute sp_who2
‘Active’ This will give details of processes which are active.
If any process which is active but in Suspended state then that SPID is the
culprit query.
So we can
correlate the data between KPID and SPID to find the exact process. Before that let we understand some common
terms.
- SPID : SPID is the SQL Server Process ID number and is assigned
by SQL Server to each new connection. It starts with one and is globally
unique. SPID 1 through 50 are reserved for system uses and are not used
for any user connections.
- KPID : KPID is the kernel -process id Under SQL Server for Windows this is the
thread ID number, also known as "ID Thread," and is assigned by
Windows when the thread is created. The Thread ID number is a system-wide
identifier that uniquely identifies the thread. KPID is visible by
querying the KPID column of master..sysprocesses. It is only filled in for
spid numbers four and higher. You can also get KPID/ID Thread from Windows Perfmon using
the "Thread" object and the "ID Thread" counter.
Now we
can find the exact session by using the KPID and SPID.
Once we
identify the sql server is the cpu culprit in task manager we need to find the exact session or process
which is causing so we can check this via Performance Monitor tool.
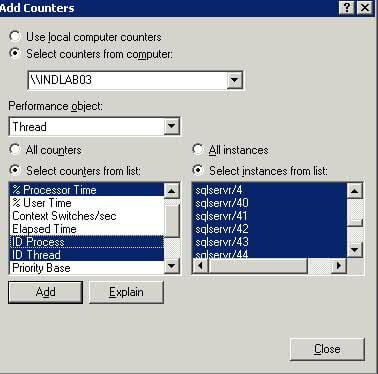
Under
performance Tool -Add the below counters.
%
Processor Time
ID thread
Thread
state
Thread
wait reason
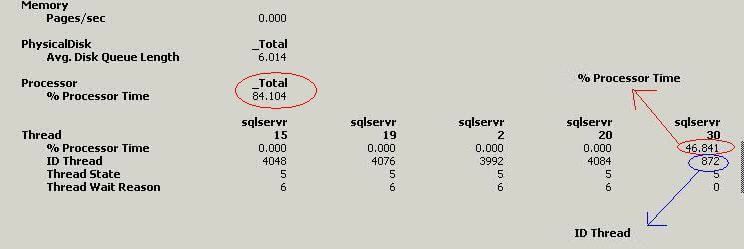
After adding Press Ctrl +R to view the
report , in the below image we can see thread 30 is using 46.841 cpu . We can
also see ID thread 872 which we need to use as KPID in sysprocesses to find the
exact session.
In recent versions we can use dmv sys.dm_os_threads
with column os_thread_id which is KPID column in sysprocesses .
Select spid,kpid,dbid,cpu,memusage from
sys.sysprocesses where kpid=872
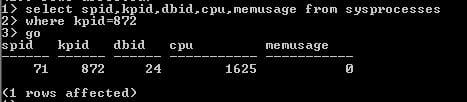
From the query above we can see SPID 71 is
causing the issue. To find how many threads and open transactions this is
running we can run this query.
SELECT spid, kpid, status, cpu,
memusage, open_tran, dbid FROM sysprocesses WHERE spid=71
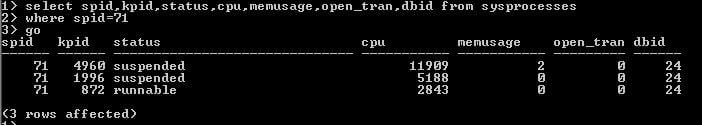
To get the exact query that is running, we can
run DBCC INPUTBUFFER using the SPID. The below output shows us that a backup
job is causing our CPU issues on our server.
DBCC INPUTBUFFER(71)
SQL server maintains the historical
data in ring buffers , we can query and find the history available on
the system at any point in time.
DECLARE @ms_ticks_now BIGINT
SELECT @ms_ticks_now
= ms_ticks
FROM sys.dm_os_sys_info;
SELECT TOP 15
record_id
,dateadd(ms, - 1 * (@ms_ticks_now
- [timestamp]), GetDate()) AS EventTime
,SQLProcessUtilization
,SystemIdle
,100 - SystemIdle - SQLProcessUtilization
AS OtherProcessUtilization
FROM (
SELECT record.value('(./Record/@id)[1]',
'int') AS record_id
,record.value('(./Record/SchedulerMonitorEvent/SystemHealth/SystemIdle)[1]',
'int') AS SystemIdle
,record.value('(./Record/SchedulerMonitorEvent/SystemHealth/ProcessUtilization)[1]',
'int') AS SQLProcessUtilization
,TIMESTAMP
FROM (
SELECT TIMESTAMP
,convert(XML,
record) AS record
FROM sys.dm_os_ring_buffers
WHERE ring_buffer_type
= N'RING_BUFFER_SCHEDULER_MONITOR'
AND
record LIKE '%<SystemHealth>%'
) AS x
) AS y
ORDER BY
record_id DESC
The above
query provides the cpu utilization from
past 15 minutes for sql server.
After find the cpu utilization how you find the active sessions causing resource usage
high. The query below can help in finding the currently executing queries
in SQL Server:If a SQL Server process is consuming high CPU, then executing the
above query can help in finding the various requests currently getting executed
inside SQL Server.
SELECT
r.session_id
,st.TEXT
AS batch_text
,SUBSTRING(st.TEXT,
statement_start_offset / 2 + 1, (
(
CASE
WHEN
r.statement_end_offset = - 1
THEN
(LEN(CONVERT(NVARCHAR(max), st.TEXT)) * 2)
ELSE
r.statement_end_offset
END
)
- r.statement_start_offset
)
/ 2 + 1) AS statement_text
,qp.query_plan
AS 'XML Plan'
,r.*
FROM sys.dm_exec_requests r
CROSS APPLY
sys.dm_exec_sql_text(r.sql_handle) AS st
CROSS APPLY
sys.dm_exec_query_plan(r.plan_handle) AS qp
ORDER BY cpu_time DESC
The output shows the data sorted by CPU. Once the query is
identified, we have several options to try in tuning the query consuming
the CPU, including:
1.
Make sure that the
statistics are up-to-date for the underlying tables used.
2.
Check if the optimizer
is suggesting any missing indexes in XML plan. If yes, evaluate and then create
them.
3.
Check if there are scan
of big tables which can be avoided, and if data can be filtered based on
access.
4.
Tune the query using
Database Engine Tuning Advisor and evaluate the recommendations given.
HISTORICAL INFORMATION TO GET QUERIES CAUSED CPU USAGE FROM QUERY
PLANS :
Sometimes it’s good to look at all queries
executed so far and get the top CPU consumers from the query plans available in
plan cache. The CPU might be normal at this point, but we want to get
historical data. This can be achieved using query stats dynamic
management views. Below query gives us an overview of cached batches or
procedures which have used most CPU historically:
select
top 50
sum(qs.total_worker_time) as
total_cpu_time,
sum(qs.execution_count) as
total_execution_count,
count(*) as
number_of_statements,
qs.plan_handle
from
sys.dm_exec_query_stats qs
group
by qs.plan_handle
order
by sum(qs.total_worker_time) desc
It’s
important to remember that above query gets data from the cached plan.
This means that, if the plan is evicted from cache for one of the top CPU
consumers, we may miss the same.
Query
execution takes long times and spikes CPU commonly because of in-correct
cardinality estimates caused by outdated statistics, Lack of Index, Server
configuration, Distributed queries, etc.
When
the server is experiencing this problem run the query in below link to list all
the queries which are executing in the server order by CPU time desc along with
plan.
{
SELECT getdate() as "RunTime", st.text as batch,
SUBSTRING(st.text,statement_start_offset / 2+1 ,
( (CASE WHEN a.statement_end_offset = -1
THEN (LEN(CONVERT(nvarchar(max),st.text)) * 2)
ELSE a.statement_end_offset END)
- a.statement_start_offset) / 2+1)
as current_statement
,qp.query_plan, a.* FROM sys.dm_exec_requests a CROSS APPLY
sys.dm_exec_sql_text(a.sql_handle) as st CROSS APPLY sys.dm_exec_query_plan(a.plan_handle)
as qp
order by CPU_time desc
}
It
could be one query which is driving the majority CPU time or Multiple queries
each driving the CPU. Look at the CPU time of the above query output.
If it
is single query/Store procedure which is driving the majority of CPU.
1. Update the stats of
tables and indexes used by the query (If the stats are up to date Estimated
rows and estimated execution will be approximately
same in execution plan
.If there is huge difference stats are out dated and requires update) .
2. Identify if the query has
used bad plan because of parameter sniffing (If the ParameterCompiledValue and
ParameterRuntimeValue is different in XML plan). Refer THIS LINK to know more about Parameter Sniffing
3. If updating the
stats and fixing the parameter sniffing doesn’t resolve the issue it is more
likely optimizer is not able to create efficient plan because of lack of
indexes and correct statistics. Run the query which is driving the CPU in
database tuning advisor and apply the recommendations. (You will find missing
index detail in xml plan but DTA is more efficient). You can follow the steps
in Tune queries using SQL
Server Database tuning advisor .
4. If the query which is
spiking the CPU is linked server query try changing the security of linked
server to ensure linked server user has ddl_admin or dba/sysadmin on the remote
server. More details regarding the issue in THIS LINK.
6. Ensure the query which is
spiking the CPU doesn’t have plan guides (xml plan will have PlanGuideDB
attribute. Also sys.plan_guides will have entries) and query hints(index=
or (option XXX join) or inner (Join Hint) join).
7.
Ensure that SET options are not changed.
If it
is Multiple queries/Store procedure are driving the CPU together.
1. Update the stats of all
the tables and indexes in the database. Using the query in below link Rebuild index and update
statistics for all the tables in database
2. If updating stats doesn’t
help and rebuilding the indexes doesn’t bring down the CPU we have to tune the
queries 1 by 1.
3. Ensure Large amount of
RAM is not causing optimizer to choose inefficient plan http://support.microsoft.com/kb/2413549
4. Ensure that we do not run
many traces at same time (commonly from monitoring tools). Use query in below
link to list all the active traces.
{
}
If the top CPU consumer is one of the system processes, check the
kind of process and see if there is any known issue about that process on support.microsoft.com. Some of the common
searches that show high CPU on SQL Server because of system processes are:
·
http://support.microsoft.com/?id=978430 (The Ghost Cleanup
task uses 100% of the CPU on an idle system in SQL Server 2008 or in SQL Server
2005)
·
http://support.microsoft.com/kb/2504603 (FIX: SQL Server
process that uses the.NET Framework 2.0 does not make any progress during a
garbage collection while CPU usage is high)
And, of course, third-party performance tuning
solutions such as SolarWinds Database
Performance Analyzer can be of use in
determining the root cause of performance issues such as high CPU usage.